Powerful Features for Serious Investors
Master the Markets with
Precision Tools.
From automated valuations to 20 years of deep financial data, explore the features that make Old School Value the gold standard for fundamental analysis.
No credit card required. 14-day free trial.
Core Analysis Engine
Everything you need to evaluate a business's intrinsic value without the manual spreadsheet grind.
Automated Valuation
DCF, Graham's Formula, and EBIT Multiples calculated instantly for any stock using real-time data.
Clean Data Only
We standardize financial statements so you can compare apples-to-apples across different industries.
Safety Checklists
Integrated Piotroski F-Score and Altman Z-Score to protect you from value traps and bankruptcy risks.
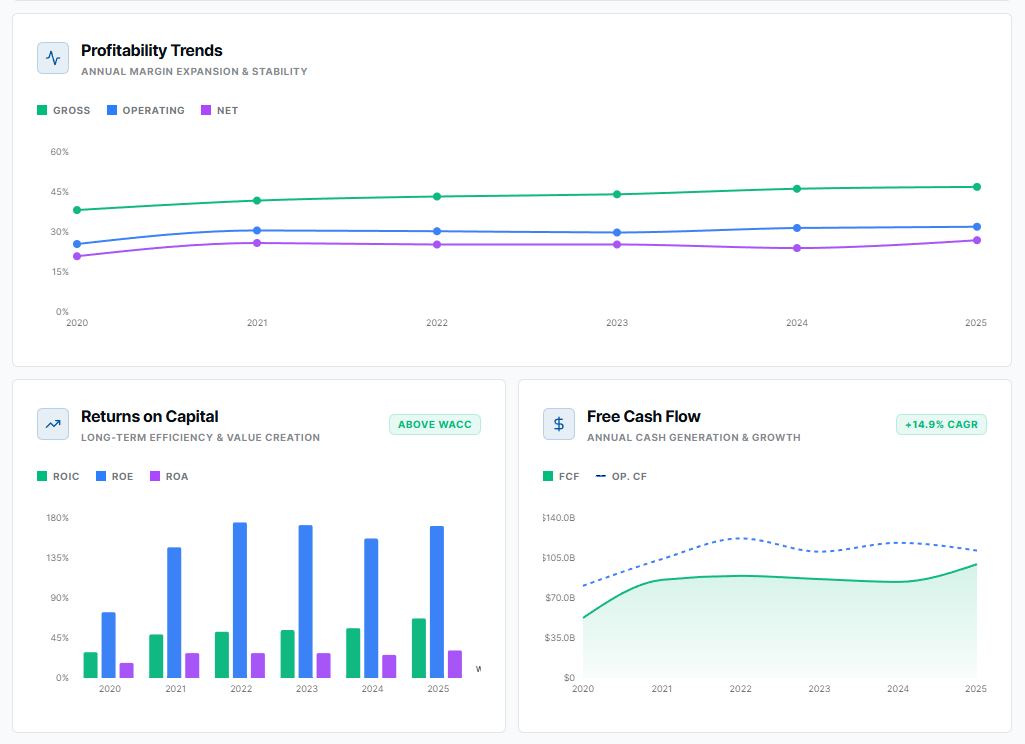
Visual Analysis
Don't squint at spreadsheets. Spot accounting red flags and growth patterns instantly with our pre-built visual dashboard.
Growth vs ROIC
Is growth creating value or destroying it?
Margins Analysis
Gross, Operating, and Net margins over time.
Debt Schedules
Visualize solvency and liquidity risks.
FCF Yield
Price vs Free Cash Flow per share.
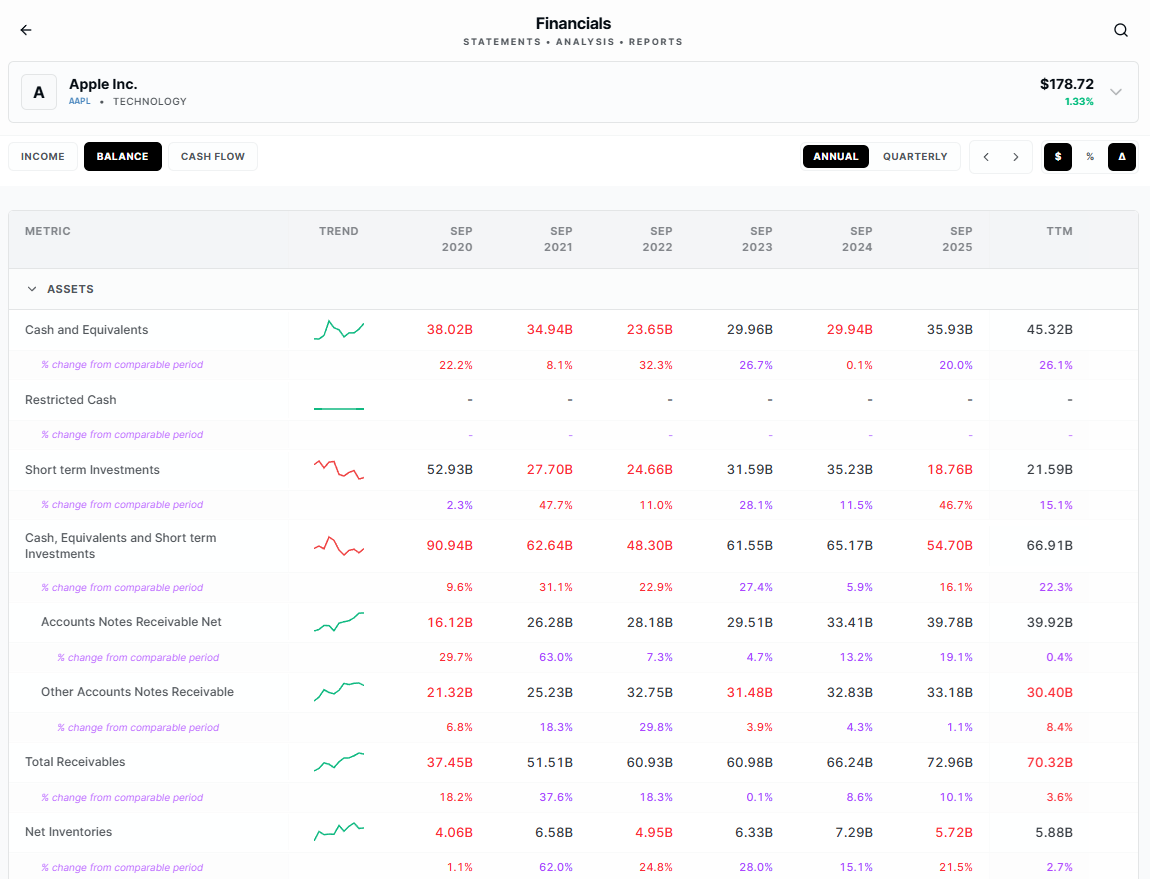
20 Years of Financial History
To understand a business cycle, you need to see more than just the last 3 years. We provide up to two decades of standardized financial statements.
- See performance through the 2008 & 2020 crises
- Identify long-term margin trends
- Analyze capital allocation over time
Automated Peer Comparison
Context is everything. We automatically pull the top competitors and line them up side-by-side on 40+ key metrics.
| Metric | AAPL (Focus) | MSFT | GOOGL | AMZN |
|---|---|---|---|---|
| Piotroski F-Score | 8 | 7 | 8 | 5 |
| ROIC (5y Avg) | 28.4% | 22.1% | 18.5% | 9.2% |
| Gross Margin | 44.1% | 68.2% | 56.1% | 42.5% |
| EV / EBITDA | 21.5x | 24.2x | 19.8x | 32.1x |
Sample data for illustration purposes
Ready to upgrade your research?
Join 10,000+ value investors using professional-grade tools to find alpha and avoid expensive mistakes.